Speeding up XML processing using Chronicle Queue
Background
Inspired by frustration with performance problems with a trade XML processing solution…
How fast?
Below I describe an XML processing pipeline that can:
- Ingest and persist to disk XML at the rate of 150MB/sec, while simultaneously
- Normalising each incoming XML (extract values from the XML, 50 tags configured as xpaths) and persist results to disk, while simultaneously
- Building an index over all normalised values to in-memory store and absorbing thousands of queries executed against indexed data
The test scenario described below (see throughput test) simulates the ingestion of 1M XML messages of average size 29K, normalisation of them, indexing of them and executing queries against the index continuously. The test runs in 10 minutes, converting 29G of XML into 1.1GB of normalised data and an index of size 500MB, while concurrently executing 2000 queries returning 1.2GB of data.
Above scenario focuses on throughput but this pipeline also exhibits very impressive latency numbers - with messages moving between components typically < 20μs.
How does it work?
Design Principles
- Fast & efficient
- Able to absorb significant load on a single box - no hadoop etc. cluster required
- Mechanical sympathy
- Cache oblivious, streaming architecture
- Minimise pointer chasing - XML and Java objects backed by byte array
- No thread synchronisation - components are single threaded, although quite possible to use a thread pool for CPU-intensive tasks
- Efficient usage of disk - as little random access as possible
- Use the OS features - make use of its VM subsystem to transparently map files to memory and vice versa
- Pipeline architecture
- Each component acts like a unix utility - accepting input from a Chronicle, and writing output to a Chronicle
- Persist to disk so processing can restart in case of component failure
- Minimise GC
- Most components don’t generate garbage in their core processing, if they do it is only when they call out to 3rd party libraries
- Because of low amount of garbage created, GC pauses are short and heap usage low
- Careful choice of libraries and implementation for performance e.g. index implemented with Trove collections to reduce memory use, GC, and pointer chasing
Implementation
- Peter Lawrey’s fantastic Chronicle-Queue
- Trove collections
Solution
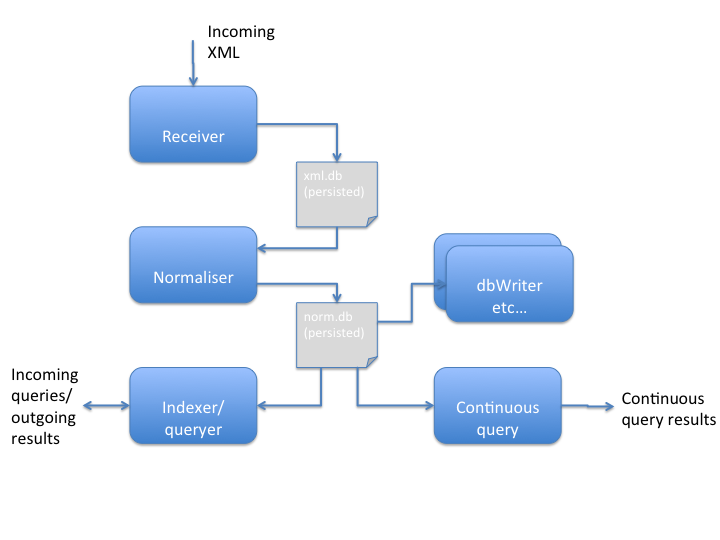
Components
Receiver
Receives XML, assigns an ID, and persists to disk together with received timestamp. Core processing does not generate any garbage and streams XML straight out to disk. Very low latency and very high throughput. This job of this component is to “land” incoming XML to disk and make it available for downstream processing pipelines.
Normaliser
“Tails” persisted XML queue, loads XML, extracts configured subset of individual tag values from the XML, and persists to disk in normalised queue. Three versions have been implemented:
- JAXB implementation converts the XML to a Java object in memory - this takes the most up-front time but is suitable for very complex and very numerous extractions of tags from XML
- XOM implementation uses XOM to execute configured xpaths against XML
- Custom implementation that makes use of a low latency hand-written XML parser and cut-down support for an xpath subset. Low garbage and considerably lower latency and higher throughout than JAXB and XOM impls. This is used for benchmark figures quoted on this page. Further performance optimisation on this component still possible.
Indexer
Tails normalised queue and builds an in-memory index of every normalised value.
Queryer
Allows basic queries to be executed suchs as:
- load xml or normalised data by ID
- find xml or normalised data by indexed values
ContinuousQuery
Continuous queries e.g. count of received messages in last 10 seconds, alert where a trade’s attributes have changed
DBWriter
Not implemented yet. Will write to relational tables.
Downstream analytics
Not implemented yet.
Latency test small messages
Generate small XML messages (955 chars) at a slower rate than throughput test so as to reduce load on system and ensure that all components can keep up.
- MacBook Pro 4 cores and SSD:
- Average latency from msg written by receiver, to normaliser reading it is 9μs with 90% under 10μs and 99% under 15μs
- Average latency from msg written by receiver, to normaliser reading it, and parsing XML is 10μs with 90% under 11μs and 99% under 21μs
- Average latency from msg written by normaliser to indexer reading it is 10μs
- Average latency from msg written by normaliser to indexer reading it and adding to in-memory index is 16μs
Performance
Test harness uses approx 110 example FpMLs from FpML website, some of which have been increased in size, and values substituted values e.g. tradeId, tradeDate etc. Average size of each XML file is approx 29K.
- Test scenario is to send 1M FpML files, with a total size of approx 29GB. These XMLs are generated using the test harness and passed to Receiver. All components are run simultaneously
- Normaliser tails received XML queue and normalises using custom implementation before writing to normalised queue
- Indexer tails normalised queue and builds in-memory index
- During the test run the Queryer is run to repeatedly execute the same queries:
- get all of a particular type
- get all on tradeDate of X
- get normalised data by random ID
- get xml by random ID
- get count.
Throughput test
To test what happens when you throw as much XML in the front only constrained by write speed to disk. Not entirely realistic as super-fast no garbage XML generation component actually embedded in receiver for maximum speed.
- EC2 c3.xlarge
- Total test execution time 550 seconds
- Receiver completed in 200 seconds, persisting 1M messages at 5K msgs/sec, each message average #chars 28,867 (chars range 2,082-1,614,103) (148 million chars/sec)
- Normaliser completed in 550 seconds, reading, normalising and persisting 1M messages at 1,800 msgs/sec (this is the bottleneck)
- Indexer completes processing in 550 seconds, reading and indexing 1M messages
- Queryer executes during entire test run, executing approx 2,000 queries, returning a total of 1.25G of data, (1.4M rows - average 700 rows per query), in an average of 220 ms per query
- Total test execution time 550 seconds
- MacBook Pro 4 cores and SSD:
- Total test execution time 1013 seconds
- Receiver completed in 432 seconds, persisting 1M messages at 2,300 msgs/sec, each message average #chars 28,867 (chars range 2,082-1,614,103)
- Normaliser completed in 865 seconds, reading, normalising and persisting 1M messages at 1,100 msgs/sec
- Indexer completes processing in 1013 seconds, reading and indexing 1M messages
- Queryer executes during entire test run, executing approx 1,800 queries, returning a total of 672,000 rows (average 366 rows per query), in an average of 515 ms per query
- Total test execution time 1013 seconds
- MacBook Pro 4 cores and HDD:
- Total time 2484 seconds
- Receiver completed in 1561 seconds
- Normaliser completed in 2464 seconds
- Indexer completed in 2484 seconds
- Approx 2180 queries, total of 1,634,000 rows, 749 average, avg 1,100 ms per query (because the test takes longer, more queries executed!)
- Total time 2484 seconds
Latency test
Generate XML at a slower rate than throughput test (750 msgs/sec which is about 20 million chars/sec) so as to reduce load on system and ensure that all components can keep up.
- EC2 c3.xlarge
- Total test execution time 1350 seconds
- Receiver completed in 1340 seconds, persisting 1M messages at 750 msgs/sec, each message average #chars 28,867 (chars range 2,082-1,614,103) (20 million chars/sec)
- Normaliser completed in same time, reading, normalising and persisting 1M messages at same rate as receiver
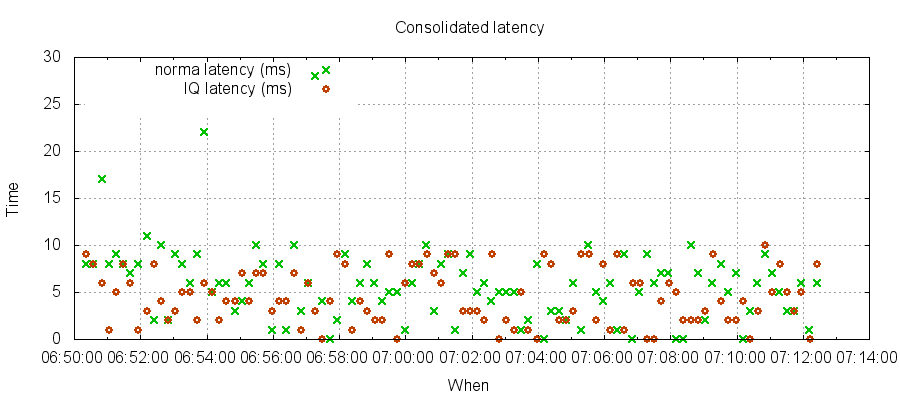
- Average latency from msg written by receiver, to normaliser reading it and normalising it is 6ms, with 99% latency under 22ms
- Indexer completes processing in same time, at same rate as receiver
- Average latency from msg written by normaliser to indexer indexing it is 5ms, with 99% latency under 9ms
- Queryer executes during entire test run, executing approx 4,100 queries, returning a total of 3.4G of data, (4M rows - average 970 rows per query), in an average of 260 ms per query
- Total test execution time 1350 seconds
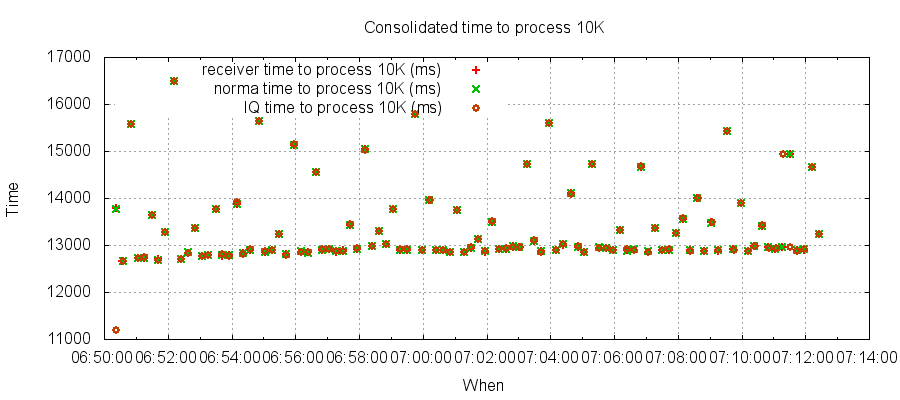
Throughput
See below throughput for each of receiver, normaliser, indexer. Each point is 10K messages.
Latency