Reducing tail latencies with a Chronicle Queue Enterprise
Background
Chronicle Queue is a pure Java low-latency unbounded persisted queue. When benchmarking Chronicle Queue, latencies tend to be excellent up to high percentiles until sustained throughput limits are reached; these sustained throughput limits are determined by disk performance, OS version and configuration. Unfortunately it seems that - despite OS virtual memory pages (and thus the disk) being used in a predictable forward-only manner, sometimes the OS introduces a pause in processing. We can see these in the graphs below.
Chronicle Queue works by reading from and writing to memory-mapped files. These files are mapped into the process’ address space in fixed size pages. Pages are loaded on-demand as the queue is read from or written to. The OS keeps these pages in the page-cache in case they will need to be accessed frequently. As system memory is used, it is necessary for the OS to free up space in the page-cache, by copying the contents of memory to disk.
All timings in this article make use of the following benchmarking methodology: using JLBH we send a sustained number of 32 byte messages per second (accounting for coordinated omission) and these messages are timestamped then written in to a Chronicle Queue. Another thread waits for these messages to arrive and picks them up, recording the difference between the time after reading vs the timestamp from before writing and records in a histogram. All experiments were run on an un-tuned CentOS server.
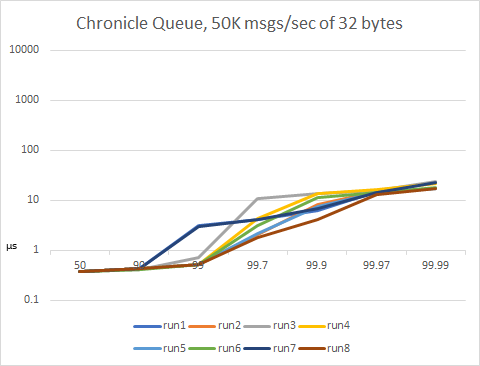
Chronicle Queue, 50K msgs/sec of 32 bytes
We execute 8 runs of 200sec each, each run writes ~320MB. Latencies increase with increasing percentiles but they remain reasonably low, the worst 99.99th percentile is under 25μs. Vertical axis is logarithmic.
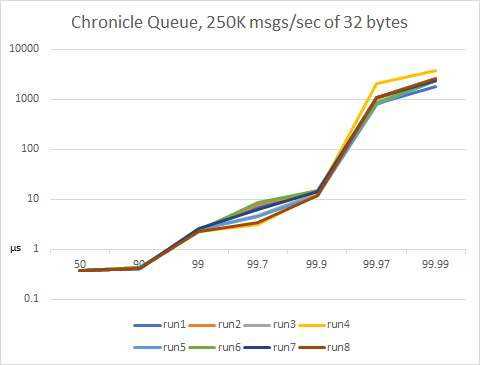
Chronicle Queue, 250K msgs/sec of 32 bytes
We execute 8 runs of 100sec each, each run writes ~800MB. Here we see high percentile pauses appearing. We can see that latencies are low and stable beneath the 99.97th percentile but, once there, they start to increase to the low milliseconds - 99.99 is ~2.5ms. Vertical axis is logarithmic.
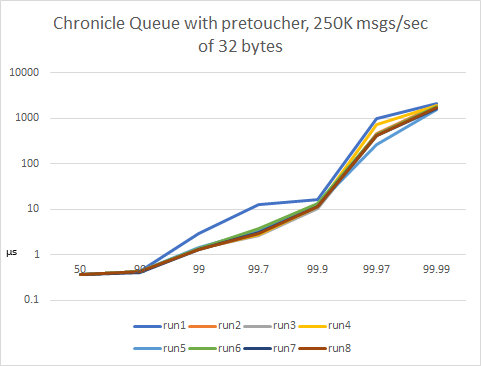
Chronicle Queue with pretoucher, 250K msgs/sec of 32 bytes
If Chronicle-Queue’s pretoucher is used, this improves the high percentiles (99.97 cut in half and 99.99 reduced by 1/3rd), but they are still sub-optimal. Vertical axis is logarithmic.
To minimise latency of writes, the pretoucher is designed to be run in a separate thread (or process) and aggressively ‘pre-touch’ the pages in a queue, so that they are resident in the page-cache (i.e. loaded from storage) before they are required by the application.
Why do we see these delays and how to fix
The short answer is that the OS is introducing the delays, because it is stalling the process while waiting for a page to be read from or written to disk. You can reduce these delays:
- Making use of Chronicle Queue’s pretoucher helps, and research continues into how to make the pretoucher work more effectively.
- Mapping the queue to /tmpfs removes delays caused by disk I/O, but only if it is small enough and you have a suitable replication or backup strategy.
- Tuning of the BIOS and OS is effective, although requires patience and expertise: power states, BIOS, kernel, RAID, even changing to an alternative file system all help.
But, a straightforward way to mitigate this (if you have Enterprise Chronicle Queue) is to set a couple of parameters when creating your queue:
    builder.readBufferMode(BufferMode.Asynchronous);
    builder.writeBufferMode(BufferMode.Asynchronous);
    builder.bufferBytesStoreCreator(RB_BYTES_STORE_CREATOR_MAPPED_FILE_TMPFS);
which configures Chronicle Queue to run in aync mode to absorb any latencies from the OS. In the above example, the ring buffer is mapped to a file (stored in this case in /tmpfs which is a high-speed file system) so that other processes can see it. All reads and writes from/to the queue go to the ring buffer, and a separate handler is registered to drain any writes made to the ring buffer to a the underlying queue.
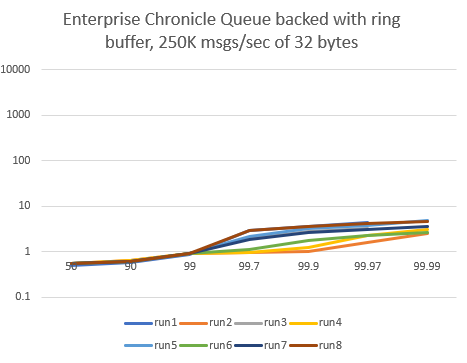
Enterprise Chronicle Queue in async mode, 250K msgs/sec of 32 bytes
With async mode, pauses at high percentiles are drastically reduced by the above 3 lines of code, the worst 99.99th percentile is under 5μs. Vertical axis is logarithmic.